Supply chain KPIs: measuring success in logistics
Supply chain KPIs are measurable values used to assess a company’s development and implement continuous improvement actions. This series of data, ratios and percentages constitute a solid foundation on which we can base our decision-making in pursuit of logistics excellence.
Logistics accounts for a significant part of the cost linked to the manufacture and marketing of every product. As a result, businesses promote the analysis of processes related to the procurement, storage and transport or distribution of goods. Below, we’ll go over the main types of logistics indicators and several examples of KPIs used to assess supply chain management.
What are supply chain KPIs?
Logistics KPIs (key performance indicators) are numerical data relationships that demonstrate a process’s effectiveness by comparing it with a specific point in the firm’s history or another baseline metric (for example, when supply chain benchmarking is carried out). This makes it possible to identify upward or downward trends and act accordingly.
Supply chain KPIs enable you to quantify the performance of a wide range of processes: goods receipts, storage, order preparation, inventory management, dispatches, deliveries, transport and returns management, among others. The ultimate goal of using KPIs in logistics is to improve productivity and optimise costs while maintaining or increasing service quality.

KPIs and objectives: tools for measuring logistics performance
It should be noted that KPIs alone are not enough for decision-making: it’s necessary to set performance targets that add context and a goal to be achieved within a specific time frame.
As we explained in our article on the role of KPIs in the warehouse, logistics throughput is usually measured on the basis of four types of objectives: time, cost, productivity and service quality. Each logistics KPI, thus, can be framed in a specific area of the supply chain, but it will also relate to one of those four logistics performance attributes.
For example, within the warehouse KPIs referring to the goods dispatch process, complete dispatched orders are an indicator of service quality. Meanwhile, the KPI for orders dispatched per hour reflects operator productivity.
Types of KPIs according to logistics phase
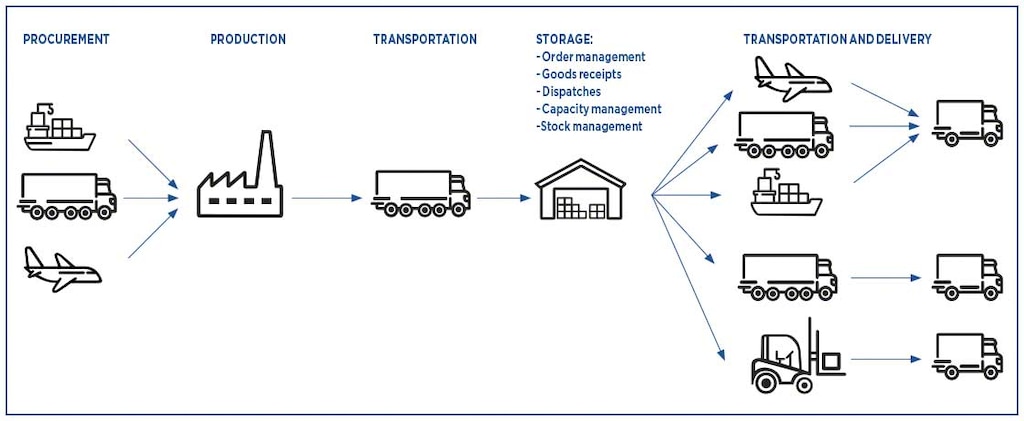
In logistics, the most common KPIs are those that are defined in terms of the various areas of work that make up the supply chain. The following are some examples of supply chain KPIs:
KPIs for procurement or purchasing
Supply chain KPIs centered on procurement are aimed at monitoring new stock-purchasing procedures and negotiations carried out with suppliers.
Examples of KPIs for purchasing:
- Failed deliveries: calculates the percentage of deliveries that were unsuccessful because the supplier didn’t comply with the agreement established in terms of service or product quality. Failed deliveries = Packages rejected ÷ Total purchase orders received x 100
- Supplier compliance rate: expresses supplier effectiveness and reflects the level of delays in deliveries to the warehouse of products purchased. Supplier compliance = Late orders ÷ Total orders received x 100
- Purchase order lead time: allows you to calculate the time elapsed from the time the purchasing department places the order with the supplier to the moment it is received at the installation. Purchase order lead time = Date of receipt of order − Issue date
KPIs for logistics transport
Transport KPIs facilitate the analysis of the logistical impact of goods movements along each link of the supply chain. Management of the final leg of delivery or the last mile is especially important here due to its complexity and, thus, greater cost.
Examples of transport KPIs:
- Transport costs in relation to sales: this supply chain KPI shows the ratio of transport costs to sales made. Transport costs versus sales = Total transport cost ÷ Sales
- On-time deliveries: illustrates transport agility in the last mile as a percentage. On-time deliveries = No. of on-time deliveries ÷ Total no. of deliveries made x 100
- Fleet utilisation: determines the occupied transport capacity in relation to total capacity in volume (ft3) or weight (lb). Fleet utilisation = Actual capacity used ÷ Total capacity in kg or m3
KPIs for logistics storage
In the warehouse, KPIs serve to monitor the processes that take place in the installation. In our article on fundamental warehouse management KPIs, we talk in-depth about the most relevant KPIs for warehousing logistics. By way of example, we’ll list a few here:
Examples of warehousing KPIs:
- Unit cost of storage: relates the cost of storage with the number of SKUs in the installation at a given time. Unit cost of storage = Total storage cost ÷ Nominal capacity x Occupancy rate
- Internal order cycle time: indicates the time it takes to complete an order, from the time it arrives at the installation until it leaves the dispatch dock. Internal order cycle time = Order entry date − Dispatch date
- Full and on-time delivery rate: measures the number of purchase orders prepared for pickup. It shows productivity and the level of customer service. Full and on-time delivery rate = No. of full on-time orders ÷ Total no. of orders x 100

KPIs for inventory management
With these KPIs, you can analyse the movement of stock along the supply chain. They’re fundamental for all logistics areas, since the information they provide makes it possible to organise product replenishment more accurately, taking into account costs and the needs of the sales department.
Examples of inventory KPIs:
- Stock turnover: shows the number of times inventory is replenished in a specified time (if the data is annual, this will be throughout the year). The higher, the better, as this means that sales are generating profits for the company. Turnover rate = Value of SKUs sold ÷ Average stock value
- Stockouts: indicates the number of times a company wasn’t able to meet demand due to lack of stock. Stockout rate = Unfulfilled orders ÷ Total orders x 100
- Inventory shrinkage: expresses inventory accuracy via a percentage. It reflects the relationship between stock theoretically in the warehouse and the actual physical inventory. Inventory shrinkage = (Stock you should have − Stock you actually have) ÷ Stock you should have
Logistics software: the backbone of data analysis in the supply chain
In recent years, steadily rising logistics costs have been an ongoing challenge for company profitability. In fact, in 2019, the Council of Supply Chain Management Professionals (CSCMP) indicated in its State of Logistics Report that logistics costs had increased by 11.4% in the US market.
Against this backdrop, it’s no wonder data extraction for formulating supply chain KPIs is a priority for the implementation of advanced analytical projects. This is demonstrated in the Supply Chain Analytics Survey Report by US consulting firm APQC. This survey states that the main motivation for obtaining data is optimising the supply chain and keeping costs down (88% of respondents), followed very closely by improving customer satisfaction (87% of respondents).
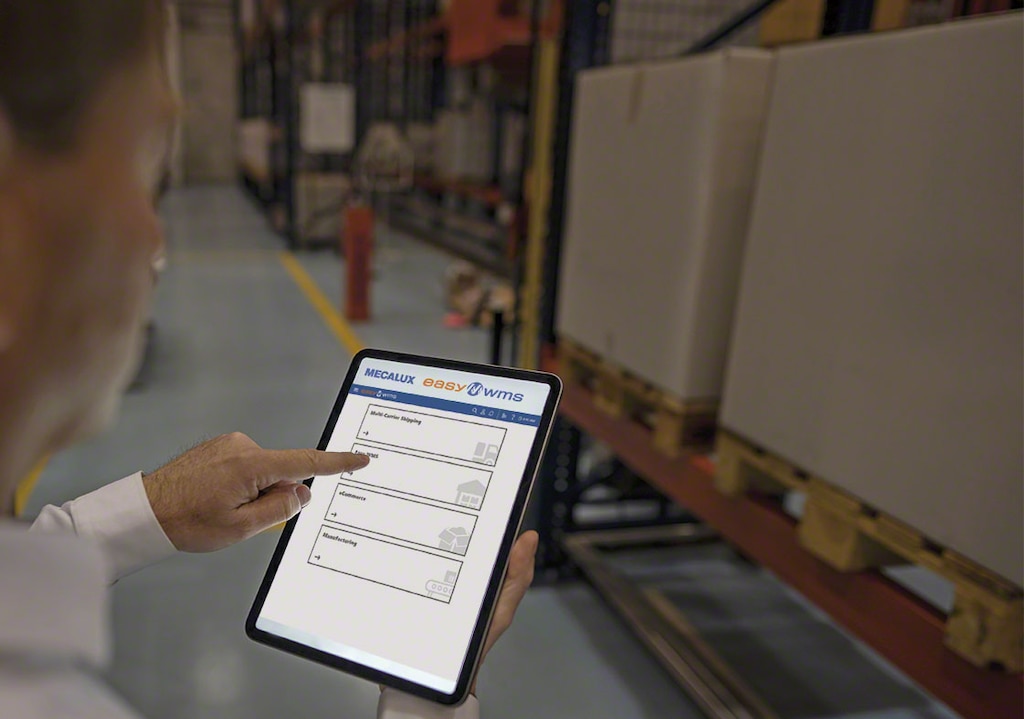
Digital transformation in logistics has facilitated the recording, processing and visualisation of data enormously, thanks especially to the implementation of software specialised in each area of the supply chain. In the case of Mecalux, the Supply Chain Analytics Software module calculates logistics KPIs that monitor warehouse operations for subsequent analysis.
Supply chain KPIs: serving efficiency
In this article, we’ve reviewed the main supply chain KPIs, illustrating several examples. Beyond the fact that the list is endless, every business has specific needs and characteristics that require KPI analysis to be personalised.
To see the potential of our Easy WMS warehouse management system in terms of data analysis, display and interpretation, don’t hesitate to contact us. We’ll show you its detailed control panel in a personalised demo.
